Crypto charts are the language of digital asset markets, translating chaotic price movement into patterns that can be studied, compared, and acted upon. When traders talk about “reading the market,” they usually mean interpreting a price chart alongside volume, volatility, and time. Unlike a simple price quote, a chart shows context: where price has been, how quickly it moved, whether buyers or sellers dominated, and how current behavior compares to prior periods. That context is crucial in crypto because markets run 24/7, liquidity shifts quickly between exchanges, and sentiment can change in minutes. A well-structured view of price action helps separate random noise from meaningful movement. Even if someone never places a leveraged trade, tracking chart structure can improve entries, exits, and risk management for spot investing.
Table of Contents
- My Personal Experience
- Why Crypto Charts Matter for Real-World Trading Decisions
- Core Components: Price, Time, Volume, and Market Structure
- Understanding Chart Types: Line, Candlestick, Heikin Ashi, and More
- Timeframes and Multi-Timeframe Analysis Without Guesswork
- Support and Resistance: The Backbone of Price Interpretation
- Trend Analysis: Higher Highs, Moving Averages, and Trendlines
- Candlestick Patterns and What They Reveal About Order Flow
- Expert Insight
- Indicators on Crypto Charts: RSI, MACD, Bollinger Bands, and Volume Tools
- Chart Patterns: Ranges, Breakouts, Flags, Triangles, and Head-and-Shoulders
- Risk Management on Crypto Charts: Stops, Position Sizing, and Volatility
- Common Mistakes When Reading Crypto Charts and How to Avoid Them
- Tools and Platforms: What to Look for in a Charting Setup
- Building a Repeatable Routine for Using Crypto Charts
- Watch the demonstration video
- Frequently Asked Questions
- Trusted External Sources
My Personal Experience
I got into crypto charts during the 2026 run-up, mostly because I was tired of buying on hype and selling on panic. At first I stared at the 1‑minute candles like they were going to reveal a secret, but it just made me anxious and trigger-happy. Over time I started zooming out to the 4‑hour and daily charts, marking basic support and resistance, and paying attention to volume instead of random Twitter calls. I still remember watching Bitcoin chop sideways for days, convincing myself a breakout was “obvious,” only to get wicked out on a sudden dip and realize my stop was basically where everyone else’s was too. Now I use charts more as a way to plan entries and exits and manage risk than to predict the future, and I feel a lot calmer because of it.
Why Crypto Charts Matter for Real-World Trading Decisions
Crypto charts are the language of digital asset markets, translating chaotic price movement into patterns that can be studied, compared, and acted upon. When traders talk about “reading the market,” they usually mean interpreting a price chart alongside volume, volatility, and time. Unlike a simple price quote, a chart shows context: where price has been, how quickly it moved, whether buyers or sellers dominated, and how current behavior compares to prior periods. That context is crucial in crypto because markets run 24/7, liquidity shifts quickly between exchanges, and sentiment can change in minutes. A well-structured view of price action helps separate random noise from meaningful movement. Even if someone never places a leveraged trade, tracking chart structure can improve entries, exits, and risk management for spot investing.
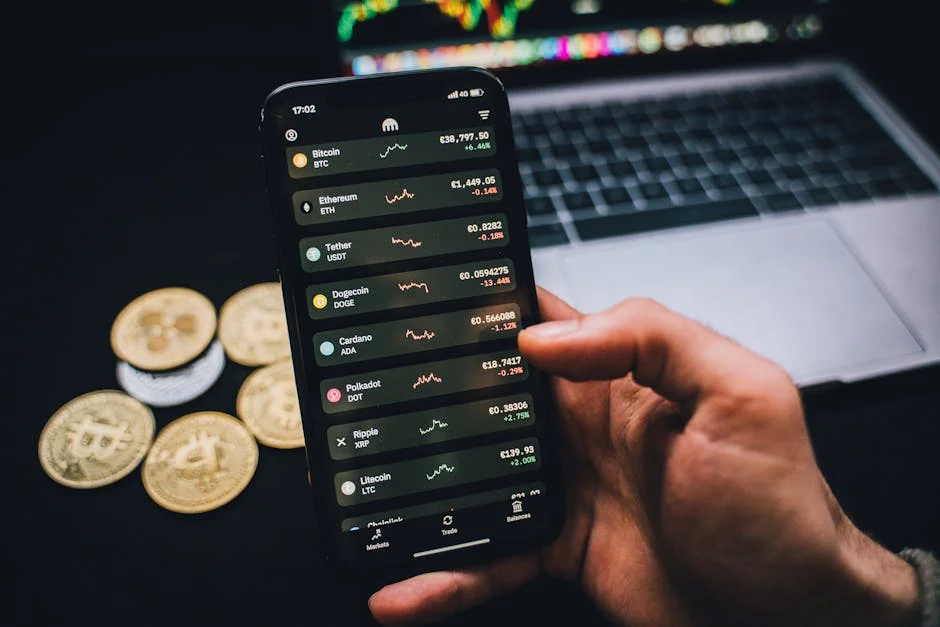
There is also a practical reason crypto charts are so widely used: the market is global and highly reflexive. News, social media, macro conditions, and on-chain events can trigger fast moves, but the impact usually appears first in price and volume. Charts allow you to see how the market is digesting information rather than relying on headlines alone. For example, a positive announcement might initially pump price, but if volume fades and price fails to break a resistance zone, the move may be fragile. Conversely, a negative headline might produce a sharp drop that quickly reclaims a key level, suggesting sellers are exhausted. Learning to read these signals through crypto charts helps traders decide when to wait, when to scale in, and when to step aside.
Core Components: Price, Time, Volume, and Market Structure
Every chart is a relationship between price and time, but crypto charts become far more informative when you add volume and market structure. Price is the visible outcome of all trades executed on an exchange, while time defines the sampling window—minutes, hours, days, or weeks. Changing the timeframe changes the story you see. A one-minute view emphasizes microstructure and order flow, while a daily or weekly view highlights trends and regimes. Traders often make mistakes by mixing timeframes without a plan, such as taking a day-trade entry based on a weekly level without confirming short-term conditions. A disciplined approach uses multiple timeframes in a hierarchy, often starting with a higher timeframe for direction and a lower timeframe for execution.
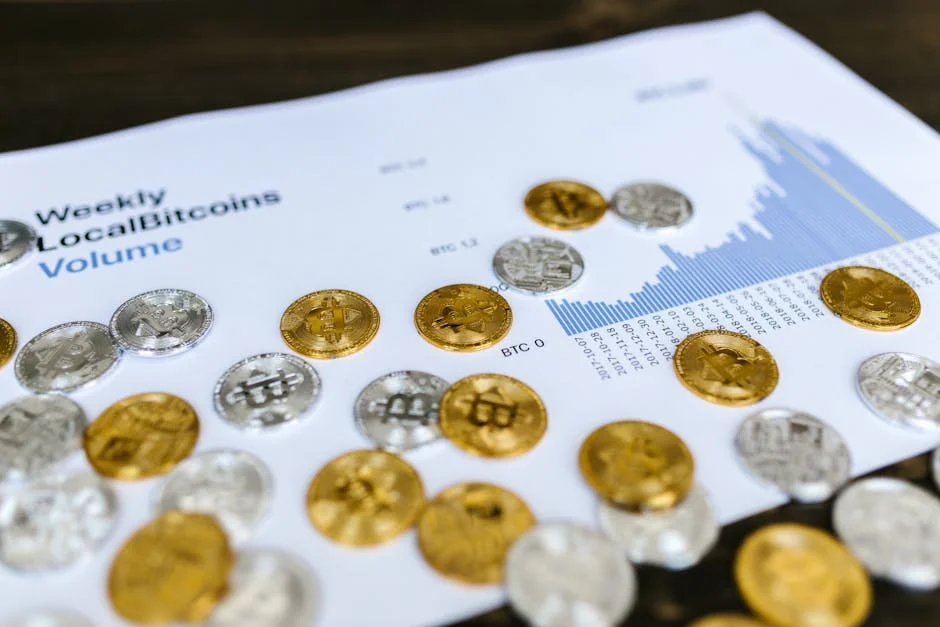
Volume is the other pillar that gives crypto charts depth. Price can move on thin volume, especially in smaller tokens, and those moves are more prone to reversals. Volume also helps confirm breakouts: a resistance break accompanied by expanding volume indicates participation and conviction; a break on declining volume can be a trap. Market structure ties it together by focusing on swing highs, swing lows, trendlines, and the sequence of higher highs/higher lows in an uptrend (or lower highs/lower lows in a downtrend). Structure offers a framework for risk: if you buy in an uptrend, you can often define invalidation below the latest higher low. Reading market structure through crypto charts reduces emotional decision-making because it provides objective reference points.
Understanding Chart Types: Line, Candlestick, Heikin Ashi, and More
Different chart types present the same underlying data in different ways, and choosing the right one can make crypto charts easier to interpret. A line chart is the simplest, typically using closing prices to draw a continuous line. It’s useful for a clean overview of trend direction, especially on higher timeframes, but it hides intra-period volatility. Candlestick charts are the most popular because they show open, high, low, and close for each candle, revealing both direction and range. The candle body conveys whether price closed above or below the open, while wicks show rejection and volatility. For many traders, candlesticks are the default because they provide detail without overwhelming complexity.
Heikin Ashi is a modified candlestick style that smooths price action by using averaged values. It can make trends appear clearer and reduce the visual noise that often causes overtrading, but it also introduces lag because the candles aren’t raw price prints. Other alternatives include bar charts, which resemble candlesticks but with a different visual structure, and area charts, which fill the space under a line. The key is consistency: switching chart types frequently can lead to conflicting interpretations. Many traders use standard candlesticks for execution and keep a secondary view (like Heikin Ashi) to confirm trend persistence. Understanding what each chart type emphasizes—and what it hides—lets you use crypto charts as a tool rather than a source of confusion.
Timeframes and Multi-Timeframe Analysis Without Guesswork
Timeframe selection is one of the most underestimated skills in reading crypto charts. A move that looks like a breakout on a five-minute chart might be nothing more than a wick inside a daily range. Conversely, a daily chart may look range-bound while the four-hour chart offers multiple tradable swings. Multi-timeframe analysis helps align entries with the broader trend and prevents trading against major levels. A common approach starts with the weekly chart to identify macro support and resistance, then the daily chart to assess trend and key zones, and finally the four-hour or one-hour chart to plan entries and manage risk. This hierarchy ensures that short-term decisions are not made in isolation.
Another crucial concept is timeframe matching to holding period. If you intend to hold a position for weeks, basing decisions solely on a fifteen-minute chart will likely lead to premature exits. If you’re scalping, relying on a weekly indicator can be too slow. Crypto charts allow you to see the same market through different lenses, but each lens must serve a purpose. Traders often benefit from defining “decision candles,” such as daily closes for swing trades or hourly closes for intraday setups. Using candle closes rather than intra-candle movement reduces false signals. When you combine timeframe alignment with clear invalidation points, you create a repeatable process that turns charts into a decision framework rather than a prediction machine.
Support and Resistance: The Backbone of Price Interpretation
Support and resistance levels are among the most practical tools on crypto charts because they reflect areas where supply and demand repeatedly collide. Support is a zone where buying interest has historically been strong enough to halt declines, while resistance is where selling pressure has capped advances. Importantly, these are usually zones, not exact lines. Crypto markets are volatile, and price often overshoots a level before reversing. Drawing zones around clusters of highs, lows, and high-volume areas can be more effective than insisting on a single precise number. When price approaches a well-defined zone, traders watch for confirmation—rejection wicks, strong closes, or volume shifts—before acting.
Role reversal is another key behavior: broken resistance can become support, and broken support can become resistance. This happens because market participants who missed the initial move may use the retest to enter, while trapped traders may exit at breakeven. Crypto charts make this dynamic visible, especially when you zoom out and see how often the same region influences price. A practical way to identify meaningful levels is to prioritize higher timeframes and look for repeated reactions. Then refine the zone using lower timeframes to see whether price respects it cleanly or chops through it. Combining support and resistance with risk rules—such as placing stops beyond the zone—helps reduce the chance of being shaken out by normal volatility.
Trend Analysis: Higher Highs, Moving Averages, and Trendlines
Trend analysis is central to interpreting crypto charts because trends often persist longer than expected. A basic definition of an uptrend is a series of higher highs and higher lows, while a downtrend forms lower lows and lower highs. Trends can be strong, weak, or transitioning, and recognizing the difference matters. In a strong uptrend, pullbacks are shallow and quickly bought; in a weakening uptrend, pullbacks deepen and rallies struggle to make new highs. Trendlines help visualize the slope of buying or selling pressure by connecting swing points. They are most reliable when they have multiple touches and align with other evidence, such as horizontal support zones or moving averages.
Moving averages are widely used on crypto charts to gauge trend direction and potential dynamic support/resistance. Common choices include the 20, 50, 100, and 200-period moving averages on various timeframes. A rising moving average with price holding above it often indicates bullish conditions; a falling moving average with price below it suggests bearish conditions. Crossovers (like the 50 crossing the 200) are popular but can be late; many traders prefer using moving averages as a filter rather than a trigger. For example, a trader might only take long setups when price is above a rising 200-day moving average. Combining trend structure, trendlines, and moving averages creates a more robust picture than relying on a single indicator.
Candlestick Patterns and What They Reveal About Order Flow
Candlestick patterns are a visual shorthand for order flow, and crypto charts make these patterns easy to spot. A long upper wick near resistance can indicate rejection—buyers pushed price up, but sellers absorbed demand and forced a close lower. A long lower wick near support can signal absorption by buyers and a potential reversal. Engulfing candles, pin bars, and inside bars are commonly used patterns, but their effectiveness depends heavily on location and context. A bullish engulfing candle in the middle of a choppy range may mean little; the same pattern at a well-tested support zone after a down move can be more meaningful.
Expert Insight
Start with the higher timeframe (daily or weekly) to identify the primary trend, then drop to the 4H or 1H chart to plan entries. Mark key support and resistance zones where price has repeatedly reacted, and wait for confirmation (a clear break and retest or a strong rejection candle) before taking a trade. If you’re looking for crypto charts, this is your best choice.
Use volume and a simple moving average to filter noise: rising volume on breakouts adds credibility, while low-volume spikes often fade. Keep risk tight by placing stops beyond the nearest invalidation level (just past support/resistance), and avoid overloading indicators—one trend tool and one momentum check are usually enough. If you’re looking for crypto charts, this is your best choice.
It’s also important to interpret patterns relative to volatility and timeframe. A “doji” on a one-minute chart may simply reflect random indecision, while a doji on a weekly chart can signal a major balance point. Crypto charts often show exaggerated wicks due to liquidity gaps, stop hunts, or sudden news-driven spikes, so traders should avoid treating every wick as a signal. Volume can validate candlestick interpretations: a reversal candle with high volume suggests stronger participation than one with low volume. The most useful approach is to treat candlestick patterns as confirmation tools rather than standalone reasons to trade. When patterns align with support/resistance and trend context, they can help time entries and define risk more precisely.
Indicators on Crypto Charts: RSI, MACD, Bollinger Bands, and Volume Tools
Indicators can add structure to crypto charts, but they work best when used to answer specific questions. RSI (Relative Strength Index) helps gauge momentum and potential overbought/oversold conditions, but “overbought” in a strong uptrend can remain overbought for extended periods. Traders often watch for RSI divergence—price makes a higher high while RSI makes a lower high—as a potential warning sign of weakening momentum. MACD (Moving Average Convergence Divergence) is another momentum tool that can highlight trend shifts, but like many indicators, it can lag during fast moves. Bollinger Bands measure volatility and can help identify squeezes (low volatility periods) that may precede expansion.
| Chart Type | Best For | Key Advantage |
|---|---|---|
| Candlestick | Spotting trends and reversals | Shows open, high, low, close (OHLC) with clear price action detail |
| Line | Quick market overview | Simple view of closing prices; easy to read at a glance |
| Depth (Order Book) | Assessing liquidity and support/resistance zones | Visualizes buy/sell walls to gauge near-term supply and demand |
Volume tools are especially valuable in crypto charts because volume often precedes price movement. Volume Profile, for instance, shows where trading activity concentrated over a price range, highlighting high-volume nodes (areas of acceptance) and low-volume nodes (areas of rejection). On-Balance Volume (OBV) attempts to track accumulation or distribution by relating volume to price direction. Funding rates and open interest (particularly for perpetual futures) can also complement chart analysis by indicating whether leverage is crowded. The key is avoiding indicator overload. Too many signals create paralysis and encourage cherry-picking. A small set—such as one momentum indicator, one volatility tool, and volume—can be sufficient when combined with price action and structure. Indicators should support what you see on crypto charts, not replace it.
Chart Patterns: Ranges, Breakouts, Flags, Triangles, and Head-and-Shoulders
Chart patterns are recurring shapes that reflect collective behavior, and crypto charts often display them clearly because the market is driven by waves of participation. Ranges form when price oscillates between support and resistance, showing a temporary balance between buyers and sellers. Breakouts occur when price escapes that balance, ideally with increasing volume and strong closes beyond the boundary. Flags and pennants are continuation patterns where price consolidates after a sharp move, often resolving in the direction of the trend. Triangles can be continuation or reversal patterns depending on context, with ascending triangles suggesting rising demand and descending triangles suggesting persistent supply.
Head-and-shoulders and inverse head-and-shoulders patterns are often associated with trend reversals, but they require careful validation. In crypto charts, false breaks are common, so traders often wait for a neckline break and retest rather than entering early. Measuring targets (like projecting the height of a pattern) can provide a rough estimate, but risk management matters more than target accuracy. Patterns are probabilistic, not guaranteed. A practical approach is to define what must happen for the pattern to be valid—such as a daily close above resistance, a volume increase, or a successful retest—and what would invalidate it. This transforms pattern recognition from guesswork into a structured plan.
Risk Management on Crypto Charts: Stops, Position Sizing, and Volatility
Risk management is where crypto charts become operational rather than educational. A chart can help define where you are wrong by identifying levels that, if breached, invalidate your thesis. Stops should be placed where the idea is broken, not where the loss feels comfortable. For example, if you buy a support retest, a stop might go below the support zone and below the swing low that defines structure. Because crypto volatility can be extreme, many traders use ATR (Average True Range) to avoid placing stops too tight. A stop that is inside normal volatility is likely to be hit even if the trade idea is correct.
Position sizing ties risk to account management. Instead of buying a fixed dollar amount each time, traders often risk a fixed percentage of capital per trade and adjust size based on stop distance. Crypto charts help calculate that distance in a rational way. If the stop must be wide due to volatility, position size should shrink accordingly. This prevents a single trade from causing outsized damage. Risk management also includes planning exits: partial profit-taking at key resistance zones, trailing stops in trends, or time-based exits if price stagnates. Without these rules, chart analysis becomes entertainment. With them, crypto charts become a tool for consistent decision-making under uncertainty.
Common Mistakes When Reading Crypto Charts and How to Avoid Them
One common mistake is overfitting—seeing patterns everywhere and forcing trades to match them. Crypto charts can be visually compelling, and the brain naturally seeks shapes, but not every consolidation is a flag and not every wick is a reversal. Another mistake is ignoring liquidity and market context. A setup that works well on a high-liquidity pair like BTC/USDT may behave differently on a low-cap token with thin order books. Slippage, spread, and sudden gaps can distort what the chart suggests. Traders also frequently mistake correlation for causation, attributing every move to a narrative rather than acknowledging that markets can move for technical reasons or because of flows unrelated to news.
Timeframe confusion is another frequent issue. A trader might spot a bullish pattern on a lower timeframe while the higher timeframe is at major resistance, leading to a low-quality entry. Similarly, relying on a single indicator can create tunnel vision. RSI divergence, for example, can persist for a long time before price reverses. Emotional trading is often the root cause behind these mistakes: chasing candles, revenge trading after a loss, or moving stops because the chart “looks like it will bounce.” A practical way to reduce errors is to use a checklist: trend direction, key levels, volume confirmation, invalidation point, and risk-to-reward. When crypto charts are approached with a repeatable process, the chance of impulsive decisions drops significantly.
Tools and Platforms: What to Look for in a Charting Setup
The best charting setup is the one that supports clarity, speed, and consistency. Traders typically need clean crypto charts with reliable data, multiple timeframes, drawing tools, and a stable interface. Features like alerting are particularly valuable because crypto runs nonstop; alerts can notify you when price reaches a key level without requiring constant screen time. Watchlists, layout templates, and synchronized crosshairs across multiple charts also improve workflow. For those who use indicators, the ability to customize settings and save indicator templates helps maintain consistency across assets. If you trade derivatives, data like funding rates, open interest, and liquidation levels can be helpful additions, but they should not clutter the view.
Data quality matters more than many realize. Different exchanges can have slightly different prices, wicks, and volume profiles, especially on smaller coins. It’s often wise to chart on the exchange you trade on, or use an index price when available. If you switch between spot and perpetual markets, be aware that perps can trade at a premium or discount, affecting how crypto charts look around volatile events. Another consideration is mobile versus desktop. Mobile charts are useful for monitoring and alerts, but detailed analysis and drawing are usually easier on desktop. A balanced approach uses desktop for planning and mobile for execution monitoring. A reliable charting environment reduces friction and helps you focus on decision-making rather than fighting the interface.
Building a Repeatable Routine for Using Crypto Charts
A repeatable routine turns crypto charts into a daily decision system rather than a source of random signals. Many traders start by scanning higher timeframes to mark major support and resistance zones, then noting whether the market is trending or ranging. Next comes scenario planning: if price breaks above a level and holds, what is the next target and where is risk defined? If price rejects, what does a bearish continuation look like and where would you exit? This “if/then” mindset prevents reactive trading. Journaling is also valuable: screenshot your charts at entry and exit, record the reason for the trade, and review whether you followed the plan. Over time, patterns emerge in your behavior, not just in price.
Consistency also means limiting the number of assets you actively track. Watching too many tokens can lead to shallow analysis and impulsive switching. A focused watchlist—major coins plus a few alts you understand—makes crypto charts more actionable. Another routine element is aligning analysis with market sessions and liquidity. While crypto trades 24/7, liquidity and volatility can vary during overlaps of major regions. Scheduling chart reviews at fixed times, such as after daily closes, can reduce noise and improve discipline. Finally, treat charts as probabilities, not certainties. The goal is not perfect prediction; it is making well-defined bets with controlled risk. When a routine is in place, crypto charts become a practical tool for navigating volatility with structure and confidence.
Watch the demonstration video
In this video, you’ll learn how to read crypto charts with confidence—spotting trends, key support and resistance levels, and common chart patterns. It breaks down essential indicators like volume and moving averages, helping you interpret price action and make more informed trading or investing decisions in fast-moving crypto markets.
Summary
In summary, “crypto charts” is a crucial topic that deserves thoughtful consideration. We hope this article has provided you with a comprehensive understanding to help you make better decisions.
Frequently Asked Questions
What is a crypto chart?
A crypto chart is a visual display of a cryptocurrency’s price (and often volume) over time, used to analyze trends and market behavior.
Which crypto chart types are most common?
When exploring **crypto charts**, you’ll commonly come across line charts that show price movement over time, bar charts that summarize each period’s trading range, and candlestick charts that display the open, high, low, and close. Among these, candlestick charts are the most widely used for trading analysis because they reveal price action and momentum at a glance.
What do candlesticks show on a crypto chart?
Each candlestick on **crypto charts** represents price action over a chosen time period, showing the open, high, low, and close. The candle’s body highlights the move from open to close, while the wicks reveal the highest and lowest prices reached during that interval.
What timeframes should I use when reading crypto charts?
Your ideal timeframe depends on how long you plan to hold a position: minutes or hours suit short-term trades, while daily or weekly views work better for swing trading and longer-term decisions. In practice, it helps to compare **crypto charts** across multiple timeframes so you can confirm whether a signal is truly strong or just short-lived noise.
What indicators are commonly used on crypto charts?
Moving averages (trend), RSI (momentum/overbought-oversold), MACD (trend/momentum), and volume/volume profile (participation and key levels).
How do support and resistance work on crypto charts?
Support is the price zone where buyers tend to step in and slow a drop, while resistance is the area where sellers often show up and limit a rally. On **crypto charts**, these levels are best treated as flexible regions rather than precise lines—and once price breaks through, support and resistance can often swap roles.
📢 Looking for more info about crypto charts? Follow Our Site for updates and tips!

Trusted External Sources
- Chart: How Common is Crypto? – Statista
Mar 17, 2026 … This chart shows the share of people owning or using of cryptocurrency in selected countries.
- Top Cryptocurrency Prices Today, Charts (Sorted by Market Cap)
Check today’s crypto prices and live market-cap rankings at a glance. Use **crypto charts** to compare coins across global currencies in real time, and quickly spot the top gainers, biggest losers, and key market movers.
- CoinMarketCap: Cryptocurrency Prices, Charts And Market …
Explore top cryptocurrency prices and **crypto charts** ranked by market capitalization, with free access to real-time updates and historical data for Bitcoin and thousands of altcoins.
- Live Cryptocurrency Chart – Investing.com
Comprehensive and easy-to-use live cryptocurrency chart that tracks the movements of hundreds of cryptocurrencies.
- The SEC’s Crypto Task Force Charts a New Course
On Feb. 10, 2026, Commissioner Hester Peirce laid out 10 key priorities for the Crypto Task Force, focused on delivering clearer rules while still encouraging innovation across digital asset markets—an update closely watched by everyone from policymakers to traders tracking crypto charts.